When running a busy contact centre or managing a customer-facing team, one of the biggest frustrations is the lack of visibility. You know calls are being made and customers are waiting, but you can’t see what’s happening in the moment. You’re stuck relying on yesterday’s reports to fix today’s problems.
That’s where Live Call Analytics Dashboards come in.
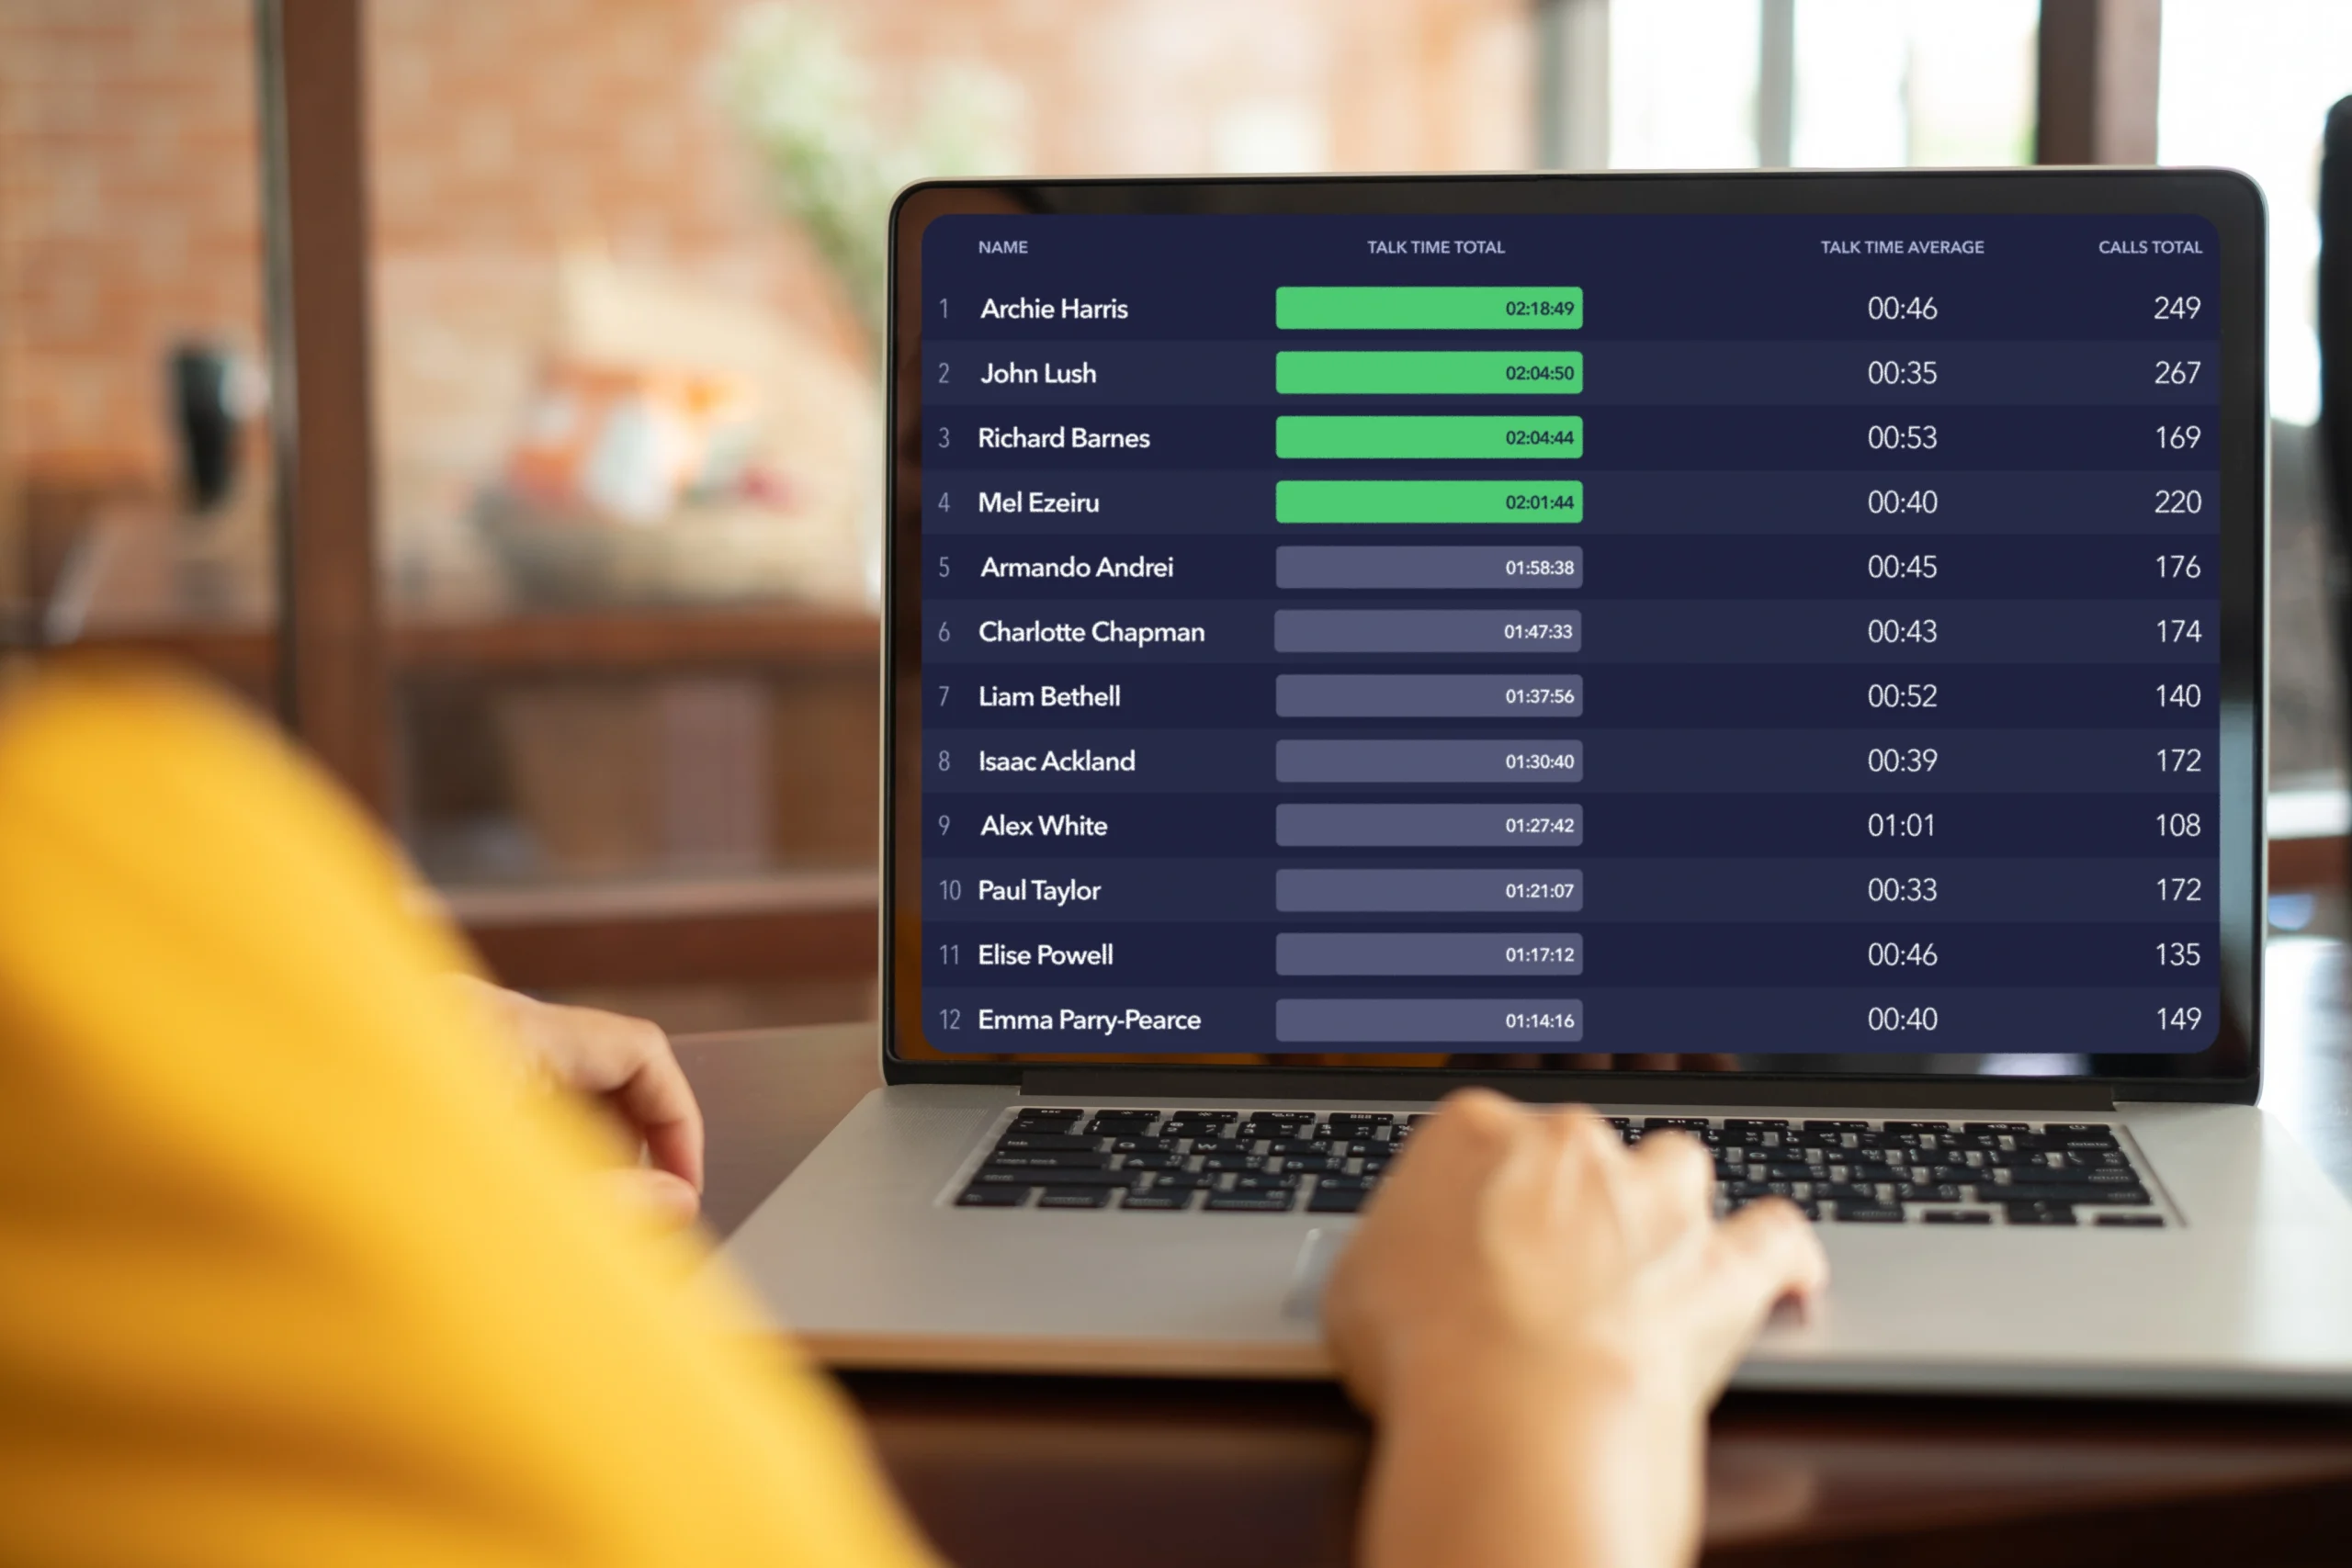
This powerful feature gives you instant, real-time visibility into live calls across your organisation. From customer wait times to call volumes and agent availability, it puts all the most important information in one place, updated by the second.
For UK businesses looking to improve service, reduce response times, and make smarter decisions on the fly, Live Analytics Dashboards offer a simple yet transformative tool.
Live Call Analytics Dashboards in a Nutshell
Imagine stepping into your office and seeing a clear visual display of every call taking place in your business, who’s speaking to whom, how long customers are waiting, how many agents are available, and which calls are in a queue. All of it live, all of it actionable.
That’s exactly what Live Analytics Dashboards bring to your business.
It’s a real-time view of your entire call operation. Whether you’re managing a small customer service team or a larger sales department, you can see call activity as it happens. It’s not about being a micromanager; it’s about giving you the situational awareness to support your team, spot bottlenecks, and respond to issues before they escalate.
Managers can immediately identify when queues are building, when a team member is handling an unusually long call, or when too many agents are offline. With just a glance, you’ll know if today is running smoothly or if something needs attention.
Staff benefit too. Live dashboards help create a shared understanding of performance and accountability. Teams can see how they’re doing in real time, giving them motivation, clarity, and a stronger connection to the bigger picture.
According to a 2022 study by McKinsey, organisations that use real-time analytics for operational decisions are 5 times more likely to make faster decisions than their competitors.* This isn’t just about data for the sake of it, it’s about having the right data, in real time, to make better choices.
*Source: McKinsey & Company, “The data-driven enterprise of 2025,” 2022
How It Works: A Technical Deep Dive
Live Analytics Dashboards are powered by a combination of real-time data streaming, cloud infrastructure, and integration with your existing telecoms setup.
At the core is a real-time data engine that captures and processes call metadata as it happens. Every time a call is made, answered, held, transferred or ended, that information is pushed instantly to the dashboard using secure APIs and live sockets. There’s no need to refresh or wait for scheduled updates; the dashboard updates itself in real time.
This engine sits within a circle.cloud’s cloud-hosted communications platform, built on a resilient and scalable architecture. It connects directly to your PBX or VoIP system, whether hosted by circle.cloud or integrated from another provider. Because it’s all cloud-based, there’s no hardware to manage and no disruption to existing systems.
Dashboards can be customised to show different data views, from high-level overviews for managers to detailed views for team leads. You can track average handling time, number of active calls, inbound vs outbound traffic, and peak call periods. Alerts can be configured, too, so you’re notified when performance dips or thresholds are met.
Security is also a key part of the system. All data is encrypted in transit and stored according to GDPR standards. Access controls mean that only authorised users can view or manage dashboard data.
And because it’s built on modern protocols like WebRTC and RESTful APIs, Live Analytics Dashboards can integrate with popular CRMs, workforce management tools, and customer databases. That means your call data isn’t stuck in a silo; it can inform other parts of your business too.

Why It Matters for Your Business
The practical benefits of Live Analytics Dashboards go far beyond the technical. This is a feature that directly impacts how your teams work, how your business performs, and how you make decisions.
For one, it boosts productivity. When you can see live call data, you can quickly deploy support where it’s needed. If an agent is dealing with a tricky customer, a manager can step in. If call volumes spike, you can bring more people online. No more waiting until the end of the day to see where things went wrong.
It also helps reduce downtime and inefficiency. You can spot when staff are idle or if systems aren’t behaving as they should, and respond in minutes instead of hours. This keeps your workflows smooth and your teams focused.
Another major benefit is cost management. By identifying peak call periods, you can schedule staff more effectively and avoid overstaffing during quiet times. You’ll reduce waste and improve resource planning.
There’s also a powerful compliance angle. Many UK industries, from finance to healthcare, face strict communication auditing requirements. With Live Analytics Dashboards, you have clear, time-stamped call records, which makes compliance and reporting much easier.
In fact, according to PwC, 62% of UK SMEs using real-time analytics report improved operational efficiency within 12 months of implementation.* That’s a tangible return on investment that goes straight to the bottom line.
*Source: PwC UK, “Tech-powered productivity for SMEs,” 2023
Better for Your Customers Too
Customers don’t care what’s going on behind the scenes; they just want fast, friendly, and effective service. And that’s exactly what Live Analytics Dashboards help you deliver.
By giving your teams live visibility into call activity, you can shorten wait times, reduce transfers, and ensure calls are answered by the right person the first time. That makes for a far more satisfying experience.
If a customer has been waiting in the queue for longer than expected, you’ll see it straight away and can act. If a high-priority client is on the line, you can make sure they’re routed to someone senior. It’s about being proactive, not reactive.
This also leads to more consistent service. Customers won’t be left hanging because of shift handovers or missed messages. Teams can see what’s happening in real time and coordinate smoothly. It’s like having a control tower for your customer service operation.
Live dashboards also support coaching and development. You can review live and historical data with your team, celebrate good performance, and identify areas for training. Over time, that creates a stronger team with better skills and higher morale, which your customers will notice.
A 2021 survey by Salesforce found that 83% of customers expect immediate interaction when contacting a company.* Live Analytics Dashboards make it far easier to meet that expectation without burning out your team.
*Source: Salesforce Research, “State of the Connected Customer,” 2021

Conclusion
In today’s fast-paced business environment, visibility isn’t a luxury it’s a necessity. Live Analytics Dashboards give you that visibility, helping you stay in control, support your teams, and improve both internal performance and customer satisfaction.
It’s a simple concept with far-reaching benefits. Whether you’re a growing SME or a tech-savvy organisation looking for an edge, this feature helps you see clearly, act quickly, and operate more confidently.
To find out how Live Call Analytics Dashboards could transform your business, get in touch with us at circle.cloud today.
Want to find out more about the circle.cloud experience? Check out our customer testimonial videos over on our YouTube channel!
FAQs
1. Can Live Analytics Dashboards be customised to suit different teams?
Yes. Dashboards can be configured to show different metrics based on the needs of your team. Whether it’s a sales team tracking outbound calls or a support team monitoring queue times, the layout and data views are fully flexible.
2. Do I need any special hardware to use Live Analytics Dashboards?
No. Everything runs in the cloud, so there’s no need for new servers or equipment. All you need is an internet connection and a browser or a supported device to access the dashboard securely.
3. Is the data on the dashboard secure and compliant with UK regulations?
Absolutely. All data is encrypted during transmission, stored securely, and handled in line with GDPR requirements. User access can also be tightly controlled with roles and permissions to ensure compliance.